Climate Change
At the Socionext Group, we believe that we can facilitate the transition to a sustainable society by using the SoCs we supply to help our customers achieve ongoing reductions in their GHG emissions. Via joint development with major customers who are leaders in the global markets and through the development of high-performance custom SoCs that leverage our proprietary multicore design techniques and AI engines and accelerators with low power consumption, we will achieve further miniaturization, higher levels of integration and lower power consumption of customer products to contribute to our customers' innovation and reduce environmental impact.
At the data centers used for design and development, we are progressively reducing the power consumption of CPUs and servers and introducing renewable energy.
In the fiscal year ended March 31, 2025, the Group identified the following climate change "risks" and "opportunities" in its business activities and calculated their financial and business impacts by scenario analysis.
Main Climate Change Risks and Opportunities
| Category | Impact of climate change on the Group | The Group's action | ||
|---|---|---|---|---|
| Risks | Transition risk | Government policy and regulation | Increased costs due to action on improving energy efficiency and reducing GHG emissions. (Higher energy costs due to carbon pricing, etc.) |
Identify in a timely way global trends and regulatory changes along with systematic investigation, implementation, and evaluation of actions. Determine GHG emissions in the supply chain and continue working with partners to reduce the emissions. |
| Technology | Higher R&D spending to maintain and improve competitiveness in the market. Higher production costs to maintain and improve competitiveness in the market. | Develop and distribute energy-saving and space-saving eco-friendly devices and solutions in partnership with customers and partners, while streamlining the development process for such devices and solutions. | ||
| Market and Reputation | Sales decrease and reputation risk due to inability to offer environmentally friendly devices. | Develop and provide products and services that contribute to reducing GHG emissions. | ||
| Regulation-driven increases in cost of materials, electricity, and other inputs. | Review the choice of parts and materials. Consider reducing power consumption by improving the efficiency of equipment installed in data centers. |
|||
| Physical risks | Acute | Disruptions at contract manufacturers and data centers due to growing severity of abnormal weather. | Regularly revise business continuity plans allowing for shutdowns or other disruptions at contract manufacturers and data centers, including decentralization of such sites. | |
| Chronic | Disruptions to outsourced production due to water shortages. | |||
| Higher power costs at data centers and other facilities due to rising air temperatures. | Study of potential power savings through more efficient use of equipment at workplaces and data centers. | |||
| Opportunities | Efficient resource use | Lower costs through more efficient use of resources (energy and water) at data centers and other workplaces | Lower costs through more efficient SoC development (use of proprietary multicore design techniques and AI engines and accelerators with low power consumption) | |
| Products and services | Higher demand, especially for products with low power consumption that help customers reduce GHG emissions and use energy more efficiently | Development and distribution of energy-saving and space-saving eco-friendly devices and solutions | ||
| Market | Acquire new customers by leveraging low-powerconsumption technologies. | Leverage low power consumption and miniaturization to acquire new customers, especially SoCs for AD/ADAS and data centers. | ||
Scenario Analysis
| Category | Scenario/Reference information |
|---|---|
| Periods |
Short term: -2026 Medium term: 2027-2030 Long term: 2031-2050 |
| Impact |
Small: 1 billion yen or less Medium: Over 1 billion yen but up to 5 billion yen Large: Over 5 billion yen *Impact on a fiscal year basis |
| Scenarios | 1.5℃/2.0℃ scenario: SDS/NZE of the International Energy Agency (IEA), RCP/SSP1 of the Intergovernmental Panel on Climate Change (IPCC) |
| Scenario analysis process | The Group analyzed risks and opportunities under a scenario in which the global average temperature rise is limited to less than 2.0℃ (partly within 1.5℃) as agreed in the Paris Agreement, as announced by IEA, IPCC, and others. |
[Impact on the Group under the 1.5℃/2.0℃ scenario]
| Category | Impact of climate change on the Group | Financial impact on business activities | ||||||
|---|---|---|---|---|---|---|---|---|
| Materiality*1 | Periods | Impact on | Degree of impact*2 | |||||
| Small | Medium | Large | ||||||
| Transition risks | Government policy and Regulation | Increased costs due to action on improving energy efficiency and reducing GHG emissions (higher energy costs due to carbon pricing, etc.) | Medium | Medium to long term | Cost |
|
||
| Technology | Higher R&D spending to maintain and improve competitiveness in the market Higher production costs to maintain and improve competitiveness in the market |
High | Short to medium term | Cost |
|
|||
| Market and Reputation | Sales decrease due to changes in customer demand Reputation risk due to inability to offer environmentally friendly devices |
Medium | Medium to long term | Net Sales | - | |||
| Regulation-driven increases in cost of materials, electricity, and other inputs | Medium | Medium to long term | Cost | - | ||||
| Physical risks | Acute | Disruptions at contract manufacturers and data centers due to growing severity of abnormal weather | Low | Medium to long term | Net Sales | - | ||
| Chronic | Disruptions to outsourced production due to water shortages | Low | Medium to long term | Net Sales | - | |||
| Higher power costs at data centers and other facilities due to rising air temperatures | Medium | Medium to long term | Cost |
|
||||
| Opportunities | Efficient resource use | Lower costs through more efficient use of resources (energy and water) at data centers and other workplaces | Medium | Medium to long term | Cost |
|
||
| Products and Services | Higher demand, especially for products with low-power consumption that help customers reduce GHG emissions and use energy more efficiently | Medium | Medium to long term | Net Sales | - | |||
| Market | Acquire new customers by leveraging low-power-consumption technologies | Medium | Medium to long term | Net Sales | - | |||
*1:The degree of materiality, i.e., “high,” “medium,” or “low” is evaluated by considering the “likelihood of occurrence” and “degree of impact” of climate-related risks and opportunities.
*2:The degree of impact for risks and opportunities that are difficult to estimate is presented as “-,” keeping the qualitative evaluation in each item.
Environmental Transition Plan
In the fiscal year ended March 31, 2025, our group established a transition plan approved by Board of Directors to reduce Scope1, Scope2, and Scope3 GHG emissions, as well as to improve environmental performance and reduce GHG emissions at the customer use stage.
(1) Reducing GHG emissions toward carbon neutrality (Scope1, Scope2 and Scope3)
Our group focuses on advanced fields such as Automotive and Data Center. As a result, we are shifting to the development of advanced technology products (2nm to 7nm) and increasing integration. High integration leads to an increase in the amount of data processed in data centers, which is directly linked to an increase in GHG emissions.
Also, in order to take full advantage of the horizontal division of labor in the semiconductor industry, our group has adopted a fabless business model with no factories and outsources product manufacturing to specialized manufacturers such as foundries and OSAT. The GHG emissions of Scope3 Cat.1 in our group, which include procurement costs from these contractors, account for more than 95% of the total GHG emissions of Scope1, Scope2 and Scope3, representing an extremely high ratio. To achieve the target of carbon neutrality by 2050, we are steadily implementing measures to reduce GHG emissions based on the transition plan, focusing on the use of renewable energy in our data centers/offices and foundries/OSATs.
(2) Improvement of environmental performance and reduction of GHG emissions at the stage of product use by customers
In recent years, with the development of autonomous driving technology and the beginning of market use of generative AI, the required computing power is expected to increase exponentially, and reducing power consumption and GHG emissions has become a social issue. By further deepening our group's technological commitment, we directly contribute to optimizing the power consumption and reducing GHG emissions in our customers' products, while our company quantitatively visualizes our contribution and uses it to formulate and track our own environmental goals, steadily promoting corporate sustainability and value.
●Main Initiatives

Introduction of Renewable Energy
Our Group introduced renewable energy in fiscal 2024 as part of our commitment to reducing environmental impact and contributing to a sustainable society. As of November 2025, renewable energy has been introduced at four of our six domestic sites, as well as at one of our six overseas consolidated subsidiaries (covering two sites).
We are also advancing initiatives to reduce GHG emissions in our design and development operations, including entering into new agreements with domestic data centers that operate using 100% renewable energy.
As a result of these efforts, 1,545,172 kWh (9.4%) of our total global electricity consumption under Scope 2 for fiscal 2024--16,416,680 kWh--has been replaced with renewable energy. In line with our environmental transition plan, we estimate to increase this proportion to approximately 20% in fiscal 2025 and approximately 30% in fiscal 2026. Our Group will continue to expand the adoption of renewable energy as we work toward achieving 100% renewable energy usage under Scope 2.
[Initiatives for Renewable Energy Adoption]
April 2024: Kyoto site - 35% renewable electricity introduced
April 2024: Nagoya site - 25% renewable electricity introduced
April 2024: Two European sites - 100% renewable electricity introduced
April 2024: Kanto Area Data Center - 100% renewable electricity introduced
April 2025: Sendai site - 100% renewable electricity introduced
November 2025: Shin-Yokohama headquarters - 100% renewable electricity introduced
In addition, as a measure to reduce GHG emissions under Scope3 Cat.4(Transport, Delivery (Upstream)), our group has started to introduce transportation services that use Sustainable Aviation Fuel: SAF in fiscal 2024.
SAF is a biomass fuel produced from sustainable raw materials (plants such as corn and sugar cane, waste cooking oil from restaurants and households, etc.) and is said to reduce GHG emissions by up to 80% compared to fossil fuels such as jet fuel. Our group plans to further reduce Cat.4 emissions by introducing more SAF.
[Fiscal Year 2024 Scope2 Global Power Consumption]

Specific actions regarding optimizing power consumption and reducing GHG emissions in customer products
The Group is working to reduce power consumption from the development stage in order to maintain and improve market competitiveness and counter rising energy costs.
(1) Efforts to reduce the power consumption of SoCs.
[Reduced power consumption by miniaturization]
In order to meet customers' demands for lower power consumption of SoCs, the Group is pursuing advances in process nodes (miniaturization and lower voltages) to achieve lower power consumption.
Comparing the power consumption of advanced and existing processes, the most advanced 2nm/3nm process consumes approximately 1/10 or less per transistor compared with the 28nm process.
We are also expanding investment in the development of leading-edge technologies (1.4nm/2nm) smaller than 2nm, and continuing to pursue miniaturization and lower voltages.
[Visualization of reduced power consumption by miniaturization and lower voltage]
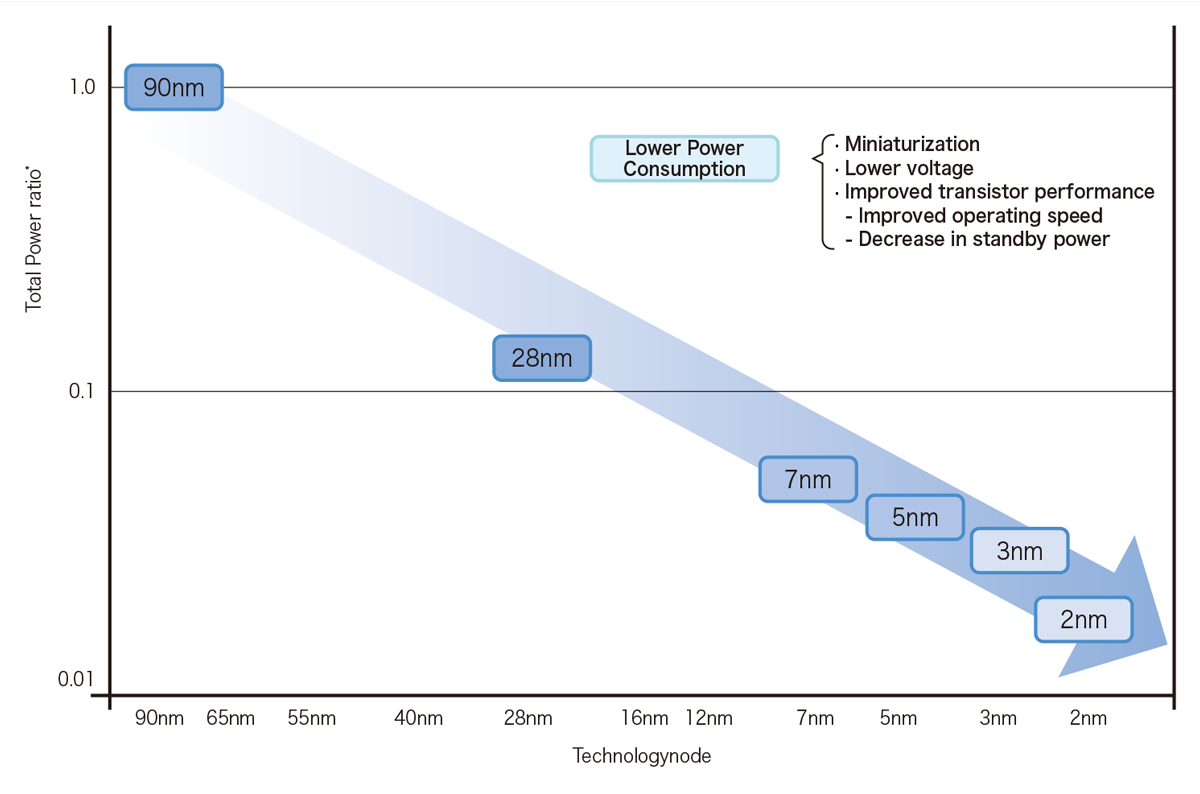 *: The vertical axis is the relative ratio of each technology with respect to the 90nm Total Power (sum of Dynamic and Leakage components)
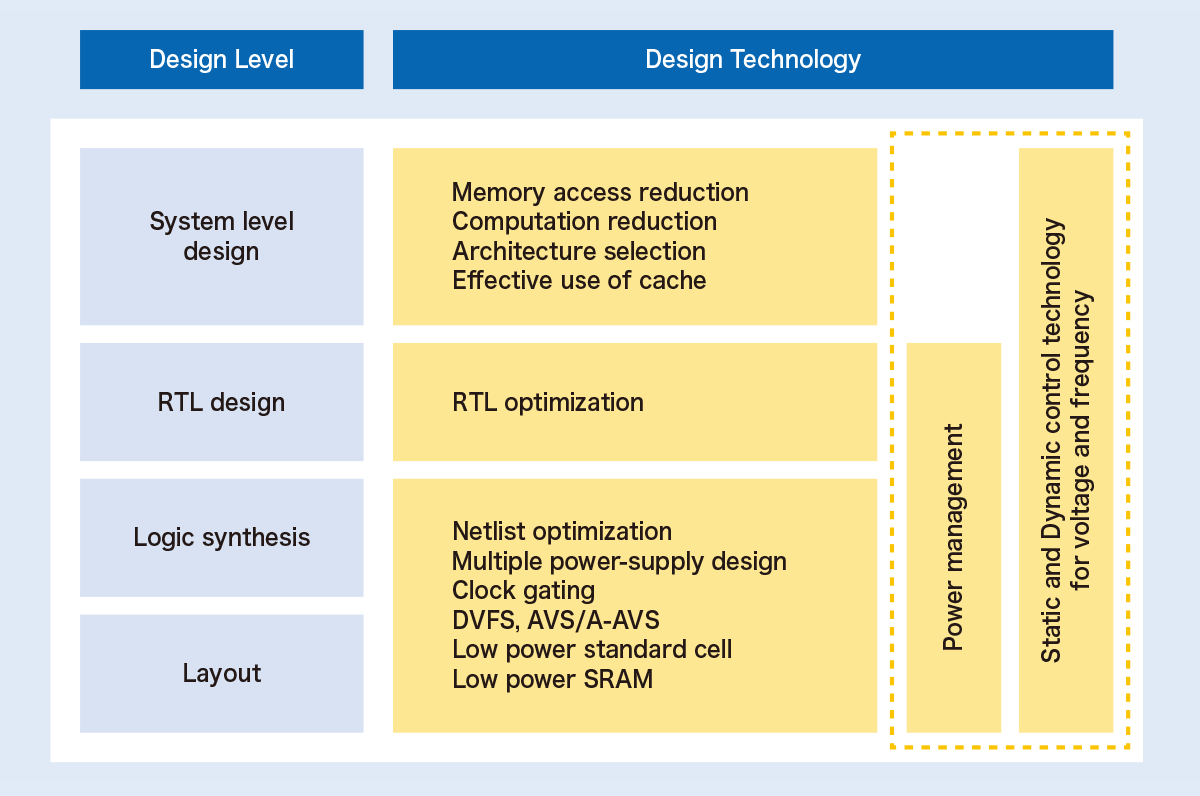
[Design technology to achieve low-power consumption]
The SoC design of the Group is taking a variety of approaches to meet customers' demands for low-power consumption. To realize low-power SoCs, it is effective to combine various technologies, not only using individual technologies (see figure below). "Reference design flow," the Group's design environment, can respond to various low-power technologies and reduce power consumption of SoC's both during operation and standby. In particular, we are systematizing and developing methods to reduce power consumption by controlling the power supply.
In addition, by adopting UPF/CPF*, the Group facilitates low-power consumption design while minimizing changes to the customer's design assets. The adoption of UPF/CPF enables highly reliable designs for lowpower technologies, which have been extremely difficult to verify in the past.
*: UPF (Unified Power Format) is a standard specification that defines the Low power design guidelines standardized as IEEE Std.1801 CPF (Common Power Format) is a standard specification that defines the Low power design guidelines standardized as Si2
[Low-power-consumption technology]
[Design/development processes and packaging technologies that enable low power consumption]
In order to achieve low power consumption in our customers' products, we have established and operate our own development flow ("Design Review" mechanism). In this system, we contribute to the reduction of GHG emissions at various stages from product manufacturing to it being put to use by listening to customers' requirements for low power and determining specifications, proposing technology selection (including process node selection) to realize the requirements, and selecting foundries and OSATs that are proactive in measures to reduce environmental impact including GHG emission reduction, among other initiatives.
In the development stage, we are working on logic/physical design and packaging design (2.5D, 3D, chiplet strategy, etc.) oriented toward low power consumption and miniaturization, and contributing to the reduction of GHG emissions through SoC products.
As described above, the Group contributes to the reduction of power consumption at our customers' end by developing and providing advanced technology products and products incorporating diverse low-powerconsumption technologies.
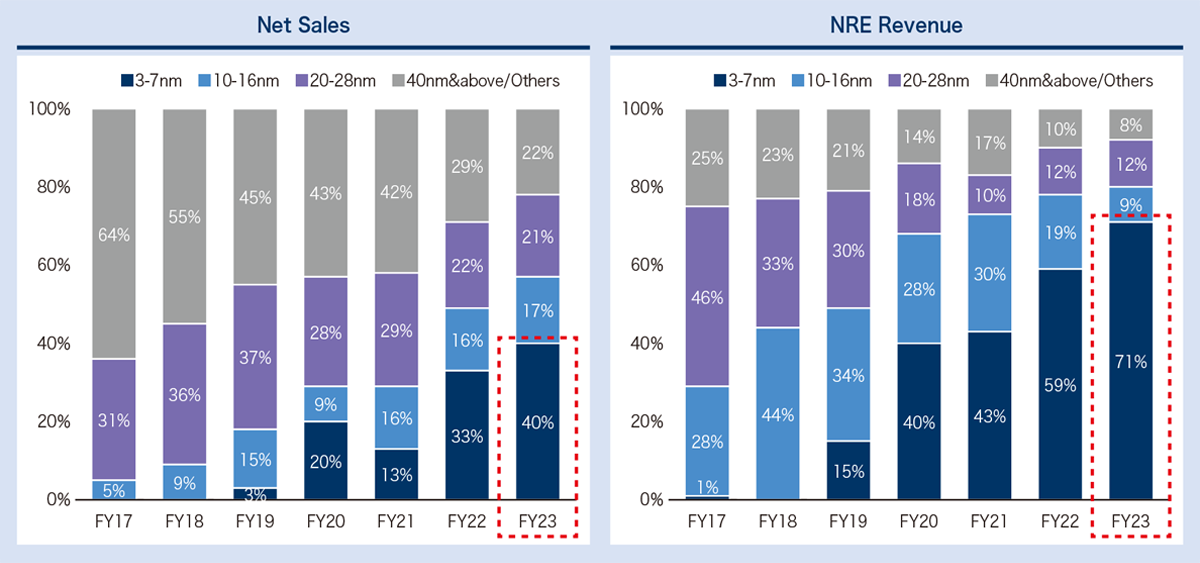
In terms of sales trends by process node, both product sales and NRE revenue are shifting toward advanced technology products (3nm to 7nm). NRE revenue (for the fiscal year ended March 31, 2025), a leading indicator of future product sales, show that advanced technology products account for 74% of total sales.
[Breakdown of sales by process node]
(2) Efforts to reduce size and space
The Group contributes to the reduction of materials used (mineral and fossil resources) by miniaturizing SoCs and to the reduction of energy consumption in the manufacturing process, from raw materials to finished products.
The miniaturization of SoCs leads to smaller size and space-saving in customers' end products, and also leads to easier countermeasures against heat generation during equipment operation. We believe that, in addition to reducing the material used and energy consumed in the manufacturing process by our customers, it leads to the realization of a sustainable society by reducing energy when using finished products (for example, improved cruising distance of electric vehicles, reduced burden on air conditioners in data centers, etc.).
In recent years, chiplets represented by 2.5D and 3D integration technologies have entered the practical stage and are expected to be a breakthrough against the limits of SoCs miniaturization. By actively promoting the adoption of this technology, the Group is promoting further miniaturization, space-saving designs, and low power consumption.
Chiplets have been commercialized by combining advanced technology (3nm to 7nm) SoC chips and multiple functional chips, and we have already begun shipping products for Data center & Networking and Automotive applications.
Aiming for a lower power consumption of chiplets, we have applied design technologies such as optimizing communication between chiplets, adopting low-power interconnect technology, and having fine control of power management for each chiplet to reduce overall power consumption.
[Conceptual image of Chiplet cross-section structure]

(3) Efforts to Reduce Power Consumption at data centers
The shift in development to advanced technology products (2nm to 7nm) has led to an increase in the volume of data processing in data centers, and power consumption now accounts for about half of the Group's GHG emissions (the sum of Scope 1 and 2). As the scale of our business expands in the future, power consumption is expected to increase further.
As a measure to reduce power consumption in data centers, the Group is sequentially introducing and replacing its equipment with low-power-consumption devices, primarily CPUs and servers. In addition, we are working to reduce power consumption by curbing CPU/server operating time through streamlining operations by improving development processes, methods, etc.
Indicators and Targets for Climate Change Response
GHG emissions (Scope1*1 and Scope2*2) by the Group for the fiscal year ended March 31, 2025, were approximately 6,527 t-CO2. Compared with the previous year, this represents a reduction of 1,448 t-CO2. GHG emissions per net sales were 3.46 t-CO2, a reduction of 0.15 t-CO2 compared with the previous year. We have set a goal for the group of becoming carbon neutral by 2050 in terms of both Scope1 and Scope2 emissions, and we are continuing to investigate and implement reduction measures that will help us achieve this goal.
[GHG Emissions]
| FY ended March 31, 2022 (t-CO2) Base Year |
FY ended March 31, 2023 (t-CO2) |
FY ended March 31, 2024 (t-CO2) |
FY ended March 31, 2025 (t-CO2) |
Year on Year (t-CO2) |
Target | |
|---|---|---|---|---|---|---|
| Scope1 | 241 | 168 | 199 | 254 | 55(128%) | Achieve carbon neutrality by 2050 |
| Scope2 | 6,846 | 8,172 | 7,776 | 6,936 | (840) (89%) | |
| Total | 7,087 | 8,340 | 7,975 | 7,190 | (785) (90%) | |
| *Emission reduction through introduction of renewable energy (Scope 2) | 0 | 0 | 0 | (663) | (663) | |
| Net Total | 7,087 | 8,340 | 7,975 | 6,527 | (1,448) (82%) |
[GHG Emissions per 100 million yen unit of net sales]
| FY ended March 31, 2022 (t-CO2) Base Year |
FY ended March 31, 2023 (t-CO2) |
FY ended March 31, 2024 (t-CO2) |
FY ended March 31, 2025 (t-CO2) |
Year on Year (t-CO2) |
|
|---|---|---|---|---|---|
| Scope1 and 2 | 6.06 | 4.43 | 3.61 | 3.46 | (0.15) |
[GHG Emissions (Global)]
| Item*1 (Unit: t-CO2) | FY ended March 31,2022 Base Year |
FY ended March 31,2023 Results*2 |
FY ended March 31,2024 Results*2 |
FY ended March 31,2025 Results*2 |
||
|---|---|---|---|---|---|---|
| S1+S2 | (Market Base) | 7,087 | 8,340 | 7,975 | 6,527 | |
| S1+S2+S3 | (Market Base) | 266,720 | 589,971 | 404,713 | 347,425 | |
| Scope1 | 241 | 168 | 199 | 254 | ||
| Carbon Dioxide (CO2) | 241 | 168 | 199 | 254 | ||
| Methane (CH4) | 0 | 0 | 0 | 0 | ||
| Dinitrogen Monoxide (N2O) | 0 | 0 | 0 | 0 | ||
| Hydrofluorocarbons (HFCs) | 0 | 0 | 0 | 0 | ||
| Perfluorocarbons (PFCs) | 0 | 0 | 0 | 0 | ||
| Sulfur Hexafluoride (SF6) | 0 | 0 | 0 | 0 | ||
| Nitrogen Trifluoride (NF3) | 0 | 0 | 0 | 0 | ||
| Scope2 | (Market Base) | 6,846 | 8,172 | 7,776 | 6,273 | |
| Emission from Data Centers | 1,359 | 3,678 | 3,655 | 3,156 | ||
| Office emissions | 5,487 | 4,494 | 4,121 | 3,117 | ||
| Scope2 | (Location Base) | 7,545 | 8,327 | 7,774 | 7,098 | |
| Scope3 | 259,633 | 581,631 | 396,738 | 340,898 | ||
| Cat.1 | Purchased Goods and Services (Procurement amount base) | 229,698 | 541,839 | 356,133 | 299,323 | |
| Cat.2 | Capital Goods (Capital investment amount base) | 27,081 | 35,620 | 35,025 | 36,455 | |
| Cat.3 | Fuel and energy-related activities not included in Scope 1 and 2 (Scope1 and 2 activity amount base) | 1,229 | 1,375 | 1,327 | 1,244 | |
| Cat.4 | Upstream Transportation and Distribution (Transport mass and distance base) | 908 | 1,308 | 1,137 | 1,050 | |
| Cat.5 | Waste Generated in Operations (Waste disposal consignment amount and amount base) | 50 | 26 | 25 | 67 | |
| Cat.6 | Business Travel (Travel expenses and number of employees base) | 201 | 953 | 2,267 | 2,016 | |
| Cat.7 | Employee Commuting (Commuting expenses paid and number of employees and working days base) | 467 | 510 | 824 | 743 | |
| Cat.8 | Upstream Leased Assets | No emissions for the relevant item | ||||
| Cat.9 | Downstream Transportation and Distribution | Not applicable for calculation in category 4. | ||||
| Cat.10 | Processing of Sold Products | No emissions for the relevant item | ||||
| Cat.11 | Use of Sold Products | No emissions for the relevant item | ||||
| Cat.12 | End-of-Life Treatment of Sold Products | No emissions for the relevant item | ||||
| Cat.13 | Downstream Leased Assets | No emissions for the relevant item | ||||
| Cat.14 | Franchises | No emissions for the relevant item | ||||
| Cat.15 | Investments | No emissions for the relevant item | ||||
[IFRS S2 Disclosure Requirements]
| Disclosure items | Indicator | Actual results* | SASB Comparison Table (code) | ||
|---|---|---|---|---|---|
| FY ended March 31, 2023 |
FY ended March 31, 2024 |
FY ended March 31, 2025 |
|||
| GHG emissions | (1) Gross global Scope 1 emissions | 168 t-CO2 |
199 t-CO2 |
254 t-CO2 |
TC-SC-110a.1 |
| (2) Amount of total emissions from perfluorinated compounds | Since the Group’s products do not contain such substances, there are no GHG emissions. | TC-SC-110a.1 | |||
| Discussion of long- and short-term strategy or plan to manage Scope1 emissions, emissions reduction targets and an analysis of performance against those targets | We aim to achieve carbon neutrality in GHG emissions (Scope 1 and 2) by 2050. | TC-SC-110a.2 | |||
| Energy Management In Manufacturing | (1) Total energy consumed | 192,639GJ | 161,037GJ | 149,701GJ | TC-SC-130a.1 |
| (2) Percentage grid electricity | 97.0% | 96.0% | 91.5% | ||
| (3) Percentage renewable | 0% | 0% | 8.9% | ||
| Water management | (1) Total water withdrawn | 4,798m3 | 4,145m3 | 2,094m3 | TC-SC-140a.1 |
| (2) Total water consumed; percentage of each in regions with High or Extremely High Baseline Water Stress | Percentage of use in areas with "extremely high" and "high" water stress is 0%. | ||||
| Product Lifecycle Management | Percentage of products by revenue that contain IEC 62474 declarable substances | Percentage of sales generated from products containing substances subject to IEC 62474 declaration is 0%. There is no use of IEC 62474 reportable substances in our Group's products that exceeds the threshold value, nor is there any use of reportable applications or substances. |
TC-SC-410a.1 | ||
| Processor energy efficiency at a system-level for: (1) servers,(2) desktops and (3) laptops | Not applicable. | TC-SC-410a.2 | |||
| Total production (Disclosure of Total Production by Manufacturing Equipment Owned by the Company and Manufacturing Equipment with a Manufacturing Contract) | 159,068 thousand units |
123,770 thousand units |
99,612 thousand units |
TC-SC-000.A | |
| Percentage of production from own facilities | 0% | 0% | 0% | TC-SC-000.B | |
| The Group outsources its manufacturing processes and does not produce at its own facilities. | |||||